
Exploring the news as an indicator for trends in the stock market
I’d like to preface this by saying that I do not have a finance background in any form and this is simply an exploratory look.
I’d also like to say that this is a code heavy analysis, but you can skip to the bottom for the conclusion and plotting.
That aside, in order to see what impact the news has on the global stock markets we’ll need to gather some data.
We’ll start with the S&P 500 as our sample of stocks. I’ve sourced this dataset from datahub.io. It’s a little out of date, so we’ll need to verify that all of the company tickers/symbols still exist.
Let’s begin by getting some of the imports we need:
import pandas as pd
import matplotlib.pyplot as plt
The S&P data is in a .csv file, so we can import it and take a look using Pandas quite easily:
sp = pd.read_csv('constituents.csv')
print(sp.shape)
sp.head(5)
(489, 3)
| Symbol | Name | Sector | |
|---|---|---|---|
| 0 | MMM | 3M Company | Industrials |
| 1 | AOS | A.O. Smith Corp | Industrials |
| 2 | ABT | Abbott Laboratories | Health Care |
| 3 | ABBV | AbbVie Inc. | Health Care |
| 4 | ACN | Accenture plc | Information Technology |
As you can see we’ve got 492 rows and 3 columns, the symbol/ticker, name of the company, and sector the company operates in.
Let’s see what sectors comprise the S&P:
print(sp['Sector'].value_counts(normalize=True))
Consumer Discretionary        0.163599
Information Technology        0.141104
Financials                    0.139059
Industrials                   0.134969
Health Care                   0.122699
Real Estate                   0.065440
Consumer Staples              0.065440
Utilities                     0.057260
Energy                        0.057260
Materials                     0.047035
Telecommunication Services    0.006135
Name: Sector, dtype: float64
sector_counts = pd.value_counts(sp['Sector'].values, sort=True)
sector_pie = sector_counts.plot.pie(autopct='%.0f%%')
sector_pie.set_ylabel('')
Text(0, 0.5, '')
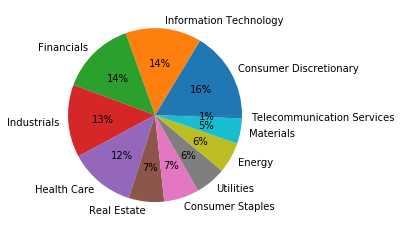
I’ve normalised the values and we can see that consumer discretionary based companies are leading (at the time of this data), with 16% of the S&P 500 being companies in that sector.
Querying for Price and Volume
We’re going to need to get the daily price for each stock, as well as information about how many shares per day are being traded.
We can use a free API by Alpha Vantage for this. They’ll give us 500 free requests per day. Just enough for our use!
I’ve written a script to query the API for a 20 day historic list of the price the equity opened at, price it closed at, as well as the high/low and the volume for that day. This information is then inserted into an SQL database for later use.
All code is viewable here on my GitHub
The script was written to account for any no longer existing tickers (via reading the API errors), and the following were identified and removed:
    Symbol                            Name                  Sector
45    ANDV                        Andeavor                  Energy
68     BBT                BB&T Corporation              Financials
83    BF.B              Brown-Forman Corp.        Consumer Staples
133   CSRA                       CSRA Inc.  Information Technology
155    DPS         Dr Pepper Snapple Group        Consumer Staples
170   EVHC             Envision Healthcare             Health Care
210    GGP  General Growth Properties Inc.             Real Estate
277    LLL     L-3 Communications Holdings             Industrials
317    MON                    Monsanto Co.               Materials
330    NFX         Newfield Exploration Co                  Energy
367    PXD       Pioneer Natural Resources                  Energy
445    TWX                Time Warner Inc.  Consumer Discretionary
494    WYN               Wyndham Worldwide  Consumer Discretionary
Let’s take a look at the freshly gathered equity data:
import sqlite3

eq_db = sqlite3.connect('equities.db')
stock_info = pd.read_sql_query("SELECT * FROM equities_daily", eq_db)
stock_info = stock_info.set_index('ticker')

stock_info.head(5)
| date | open | high | low | close | volume | |
|---|---|---|---|---|---|---|
| ticker | ||||||
| MMM | 2020-03-26 | 131.79 | 136.38 | 130.61 | 136.18 | 6693932.0 |
| MMM | 2020-03-25 | 133.15 | 134.69 | 126.80 | 131.54 | 7740084.0 |
| MMM | 2020-03-24 | 122.29 | 133.45 | 121.00 | 132.72 | 9304832.0 |
| MMM | 2020-03-23 | 128.16 | 128.40 | 114.04 | 117.87 | 7920348.0 |
| MMM | 2020-03-20 | 138.07 | 139.24 | 122.71 | 124.89 | 9582251.0 |
Querying for News
A reliable source of news that can be queried by an application can get expensive quickly. Thankfully there’s a few free/low cost solutions.
For this project I’ll be using NewsAPI.org. Similar to Alpha Vantage we get 500 free requests a day. This allows for a pretty granular search critera and has plenty of reliable news sources.
We’re only interested in the article’s published date, url, title, and description. In the same script as above on my GitHub we are parsing and inserting the relevant data to an SQL database for later use. For now it’s the previous 20 days worth of news.
Here’s a look at that news data:
news_db = sqlite3.connect('news.db')
news_info = pd.read_sql_query("SELECT * FROM news_daily", news_db)
news_info = news_info.set_index('ticker')

news_info.head(5)
| date | url | title | description | |
|---|---|---|---|---|
| ticker | ||||
| MMM | 2020-03-24 | http://www.marketwatch.com/story/cvs-plans-to-... | CVS plans to hire furloughed workers from its ... | CVS plans to hire furloughed workers from its ... |
| MMM | 2020-03-18 | https://www.marketwatch.com/story/biggest-make... | Biggest maker of face masks in U.S. is warning... | The biggest maker of medical face masks in the... |
| MMM | 2020-03-19 | https://news.ycombinator.com/item?id=22623807 | Ask HN: How should I invest $200K in this market? | Comments |
| MMM | 2020-03-03 | https://www.fool.com/investing/2020/03/03/why-... | Why Shares of 3M Are Down Today | One of the better-performing industrials throu... |
| MMM | 2020-03-10 | https://seekingalpha.com/article/4330869-is-no... | It Is Not About 3M, It Is About You | 3M is a great businesses. This makes investing... |
Let’s take a closer look at something other than 3M:
news_info.loc['CSCO', 'title']
ticker
CSCO    Why Cisco Systems Stock Slumped 13.1% in February
CSCO    Cisco committing $225M to global coronavirus r...
CSCO    Why Cisco Stock Is Becoming Attractive Followi...
CSCO    Deep Dive: You can be ‘practically stealing’ q...
CSCO    Hedge Funds Have Never Been This Bullish On Ci...
CSCO    Deep Dive: These stocks may be your best choic...
CSCO    Raymond James and Cisco to Host a Tech Talk on...
CSCO    Deep Dive: These stocks soared the most after ...
CSCO    Deep Dive: Here are Thursday’s best-performing...
CSCO    Coronavirus school cancellations lead to educa...
CSCO                        Tech Is The Solution - Nasdaq
CSCO                 Tech Is The Solution - Yahoo Finance
CSCO    Deep Dive: These stocks took the biggest hit a...
CSCO    Oxbotica and Cisco to Solve Autonomous Vehicle...
CSCO    Oxbotica and Cisco to Solve Autonomous Vehicle...
CSCO    Microsoft Teams Adds 12M Customers In A Week A...
CSCO    Where Tech Stock Valuations Stand Following a ...
CSCO    Deep Dive: These U.S. stocks fell the most aft...
CSCO    Datadog Stock Finds Support Amid Coronavirus -...
CSCO                    Cisco begins new round of layoffs
Name: title, dtype: object
In case you haven’t seen the full code for how I’m sourcing this news, it’s worth noting that I’m searching for both the ticker and full company name when it comes to news.
This means that even for easily misunderstood tickers that we’re still getting accurate news:
news_info.loc['A', 'title']
ticker
A    You Have To Love Agilent Technologies, Inc.'s ...
A    Agilent Technologies to Adjourn Annual Meeting...
A    Agilent Technologies Announces Cash Dividend o...
A    Agilent Technologies Announces Webcasts for In...
A    Is Agilent Technologies Inc. (A) Going To Burn...
A    Kim Kardashian y Kylie Jenner dejan de vender ...
A    Agilent Introduces CrossLab Connect Services f...
A       Agilent Receives Two Scientists’ Choice Awards
A    Agilent Introduces Three New Microarrays for P...
A    Agilent and Visiopharm Co-promote Advanced Dig...
A    Bill Ackman Continues To Chip Away At Largest ...
A    Is Agilent Technologies Inc. (A) Going To Burn...
A    World Flow Cytometry Industry Outlook, 2020-20...
A    Hedge Funds Have Never Been This Bullish On Sq...
A    Worldwide Genomics Markets, 2020-2027 - Compre...
A    The global protein sequencing market is antici...
A    Asia Pacific Genomics and Proteomic Tools Mark...
A    Global Environmental Sensing and Monitoring Te...
A    Proteomics Industry Analysis, 2020-2026 - Outb...
A    Global DNA Sequencing Market (2020 to 2024) - ...
Name: title, dtype: object
Sentiment Analysis - VADER
Now that we’ve got a small bit of data compiled, we can start to explore it further and see if there’s any correlations.
The first problem we’ll face is choosing how to determine the sentiment of a news article. The field of natural language processing and sentiment analysis is massive and generally complex.
I’m going to start this project off by using a simplified method of sentiment analysis - the Valence Aware Dictionary and sEntiment Reasoner (VADER) method. This is a rule-based/lexicon technique. It’s particularly good for social media related content, but we’ll test it out on news headlines now.
Normally for sentiment analysis you would remove stopwords (filler words of no value) from the text you are processing, but in the case of VADER it is advantageous to leave them in.
Let’s define our sentiment analysis function:
import nltk
from nltk.corpus import stopwords
from nltk.tokenize import word_tokenize
from nltk.sentiment.vader import SentimentIntensityAnalyzer as SIA

def determineSentiment(title):
    """
    Calculates the weighted sentiment of a piece of text
    Returns a string which is the determined score of sentiment
    """

    # VADER Polarity Score of Sentiment
    sia = SIA()
    results = []

    pol_score = sia.polarity_scores(title)
    pol_score['news_text'] = title
    results.append(pol_score)

    ## Check the compound result of the analysis
    ## Tolerances are near mirrors of those used in academia (though more sensitive to negativity)
    compound = results[0]['compound']
    if compound >= 0.05:
        return 'Positive'
    elif compound >= -0.02 and compound < 0.05:
        return 'Neutral'
    elif compound < -0.02:
        return 'Negative'
Now let’s pass in some titles and see how it classifies them:
positive_title = news_info.loc['A', 'title'][0]
print("Title: \"{}\" has sentiment: {} \n".format(positive_title, determineSentiment(positive_title)))

neutral_title = news_info.loc['F', 'title'][0]
print("Title: \"{}\" has sentiment: {} \n".format(neutral_title, determineSentiment(neutral_title)))

negative_title = news_info.loc['GPS', 'title'][2]
print("Title: \"{}\" has sentiment: {} \n".format(negative_title, determineSentiment(negative_title)))
Title: "You Have To Love Agilent Technologies, Inc.'s (NYSE:A) Dividend" has sentiment: Positive

Title: "Factbox: Ford and General Motors' electric vehicle plans" has sentiment: Neutral

Title: "The Ratings Game: Gap, Banana Republic at risk as coronavirus gives shoppers one more reason to avoid the mall" has sentiment: Negative
As you can see from the three above examples, it is capable of identifying particularly clear sentiment. However, it isn’t too good with the nuances of financial language as it is not context aware:
unclear_title = news_info.loc['GPS', 'title'][7]
print("Title: \"{}\" has sentiment: {}".format(unclear_title, determineSentiment(unclear_title)))
Title: "The Gap Inc. (GPS): These Hedge Funds Caught Flat-Footed" has sentiment: Neutral
Now let’s modify our sentiment analysis function to begin checking batches of news:
def determineSentiment(title):
    """
    Calculates the weighted sentiment of a piece of text.

    Returns a float 'compound' which is the aggregate score of positive,
    negative and neutral sentiment
    """

    # VADER Polarity Score of Sentiment
    sia = SIA()
    results = []

    pol_score = sia.polarity_scores(title)
    pol_score['news_text'] = title
    results.append(pol_score)

    return results[0]['compound']
And let’s create a function to compile the sentiment of all news for a given ticker:
def generateSentimentDict(ticker):
    """
    Generates a dictionary with a key of YYYY-MM-DD
    and a value of the aggregate news sentiment for that day
    """
    daily_sentiment = {}

    articles = news_info.loc[ticker, 'title']
    for article in articles:
        sentiment = determineSentiment(article)

        #if sentiment >= 0.05 or sentiment <= -0.05:
        # Determine the date that the article was published on
        row_with_date = news_info.loc[news_info['title'] == article]
        date = row_with_date['date'][0]

        # Add the calculated sentiment to the dict of dates
        if date in daily_sentiment:
            daily_sentiment[date] += sentiment
        else:
            daily_sentiment[date] = sentiment

    return daily_sentiment
Investigating the Trends
Now it’s time to gather all of our combined data and begin to plot and investigate things further.
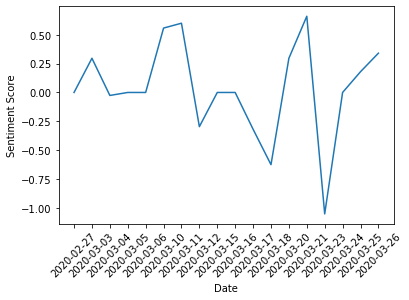
First let’s generate a dictionary of the news sentiment for the last month in regards to the Boeing Company (BA):
boeing_sentiment = generateSentimentDict('BA')
print(boeing_sentiment)
{'2020-03-10': 0.5574, '2020-03-17': -0.3182, '2020-03-23': -1.0513, '2020-03-11': 0.5994, '2020-03-06': 0.0, '2020-03-12': -0.296, '2020-03-18': -0.6249, '2020-03-21': 0.6597, '2020-03-03': 0.296, '2020-03-20': 0.296, '2020-03-15': 0.0, '2020-03-16': 0.0, '2020-03-24': 0.0, '2020-03-04': -0.0258, '2020-03-05': 0.0, '2020-03-26': 0.34, '2020-03-25': 0.1796, '2020-02-27': 0.0}
We can now plot the sentiment as a time series:
# Sort items from dict in ascending time and plot
date,sentiment = zip(*sorted(boeing_sentiment.items()))
plt.xlabel('Date')
plt.ylabel('Sentiment Score')
plt.xticks(rotation=45)
plt.plot(date,sentiment)
[<matplotlib.lines.Line2D at 0x7f73eb37d7d0>]
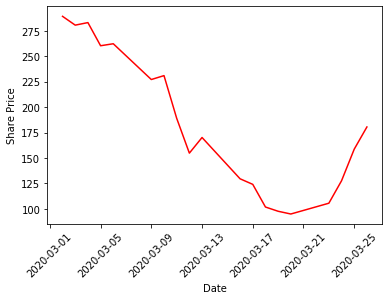
Let’s plot Boeing’s share price:
from datetime import datetime

# Pull in our 20 day pricing information earlier compiled
stock_info = pd.read_sql_query("SELECT date, close FROM equities_daily WHERE ticker == 'BA'", eq_db)

# Convert the date to the datetime format for plotting
stock_info['date'] = pd.to_datetime(stock_info['date'], format="%Y/%m/%d")

date = stock_info['date']
price = stock_info['close']
plt.xlabel('Date')
plt.ylabel('Share Price')
plt.xticks(rotation=45)
plt.plot(date, price, color='red')
[<matplotlib.lines.Line2D at 0x7f73eb228710>]
Now let’s overlay the two time series:
# Pull in our 20 day pricing information earlier compiled
date = stock_info['date']
date = date.iloc[1:]
price = stock_info['close']
price = price.iloc[1:]

# Convert sentiment from unordered dict to datetime ordered dataframe
sentiment_df = pd.DataFrame(boeing_sentiment.items(), columns=['date', 'sentiment'])
sentiment_df = sentiment_df.sort_values(by='date', ascending=False)
sentiment = sent_pd['sentiment']

fig, ax1 = plt.subplots()

color = 'tab:red'
ax1.set_xlabel('Date')
ax1.set_ylabel('Share Price', color=color)
ax1.plot(date, price, color=color)
ax1.tick_params(axis='y', labelcolor=color)
ax1.tick_params(axis='x', labelrotation=45)

ax2 = ax1.twinx()

color = 'tab:blue'
ax2.set_ylabel('News Sentiment', color=color)
ax2.plot(date, sentiment, color=color)
ax2.tick_params(axis='y', labelcolor=color)

fig.tight_layout()
plt.show()
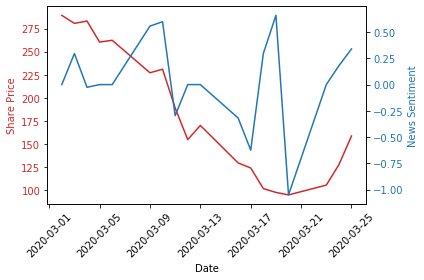
Interestingly, there seems to be a common trend between the two data sets.
However, there seems to be a strange spike in sentiment between 2020-03-17 and 2020-03-21.
After delving into the sentiment values generated in the dictionary above we can see that on 2020-03-21 the sentiment was 0.6597 and on 2020-03-20 it was 0.296.
Let’s find those titles:
news_info_ba = news_info.loc['BA']
print(news_info_ba.loc[news_info_ba['date'] == '2020-03-20']['title'][0])
print(news_info_ba.loc[news_info_ba['date'] == '2020-03-21']['title'][0])
Boeing halts dividend, share buyback program amid coronavirus pandemic - MarketWatch
Outside the Box: Coronavirus bailouts are coming: Here’s the smart way to help businesses and workers
“Boeing halts dividend, share buyback program amid coronavirus pandemic - MarketWatch”
- This is questionable in sentiment, although marked as strongly positive. In reality I’d argue this is negative as a halting of dividends indicates a poor cash situation.
“Outside the Box: Coronavirus bailouts are coming: Here’s the smart way to help businesses and workers”
- This seems like an opinion piece, and after further investigation it is. It’s a positive sentiment but not clearly relevant.
Conclusion
It would seem that there is indeed use in analysing news as a trading indicator. However I do not think it should be the only factor when considering a trade.
If those two articles were removed from the dataset we’d end up with a nearly perfect overlap of our lines. However manually intervening would be a poor choice as it would be impractical in a production system. This problem should really be fixed by using a better sentiment analysis method.
There’s many ways to improve on this:
- The analysis was during one of the most volatile markets we’ve had in many months/years
- The analysis was a very small period in length (~ one month)
- VADER is optimized for the sentiment of Tweets, not financial news headlines
- News is generally lagging with respect to the price, and markets may not always respond to the news how we think they might
Ideally I’d like to have access to more news, and certainly consider training something like a Naïve Bayes model for my sentiment determiner.
To train such a model would require a considerable amount of labeled data, which would have taken a long time to compile and hand label.
As well as that, I think this strategy could work if paired with other signals to determine a longer term sentiment. Perhaps a modified turtle strategy that uses news as one of its indicators, only trading when the sentiment is positive for multiple consecutive days (or vice versa).
Thanks for reading!